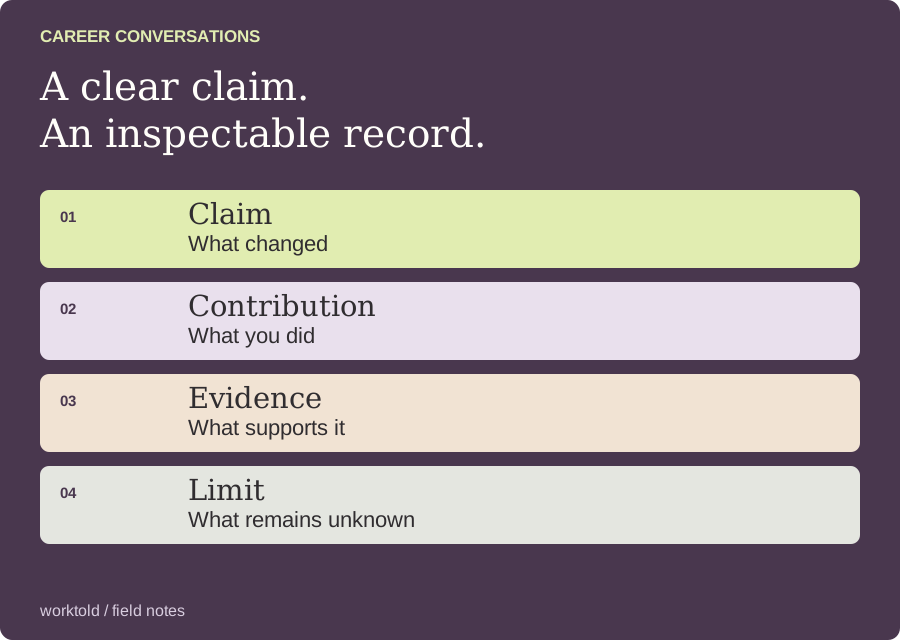
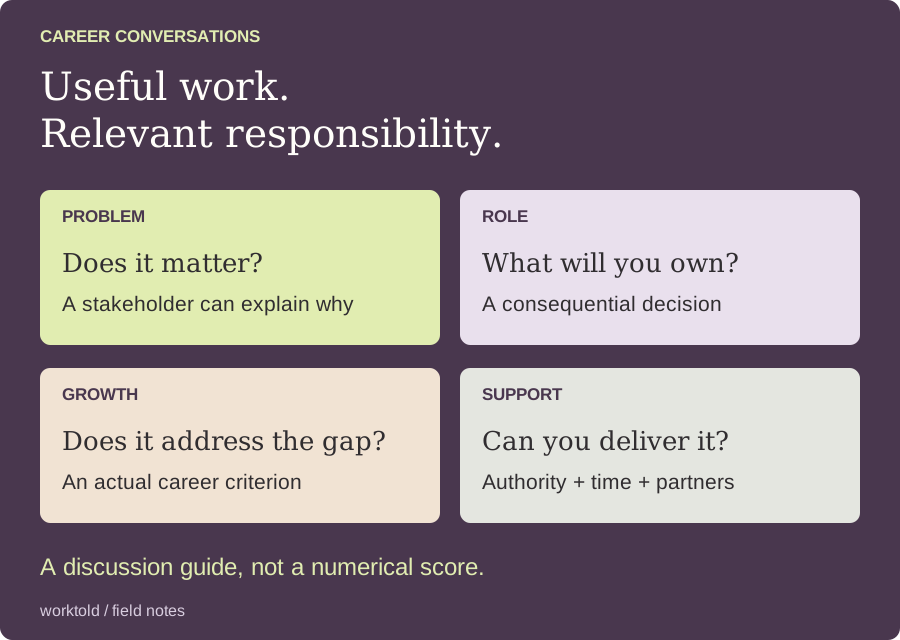
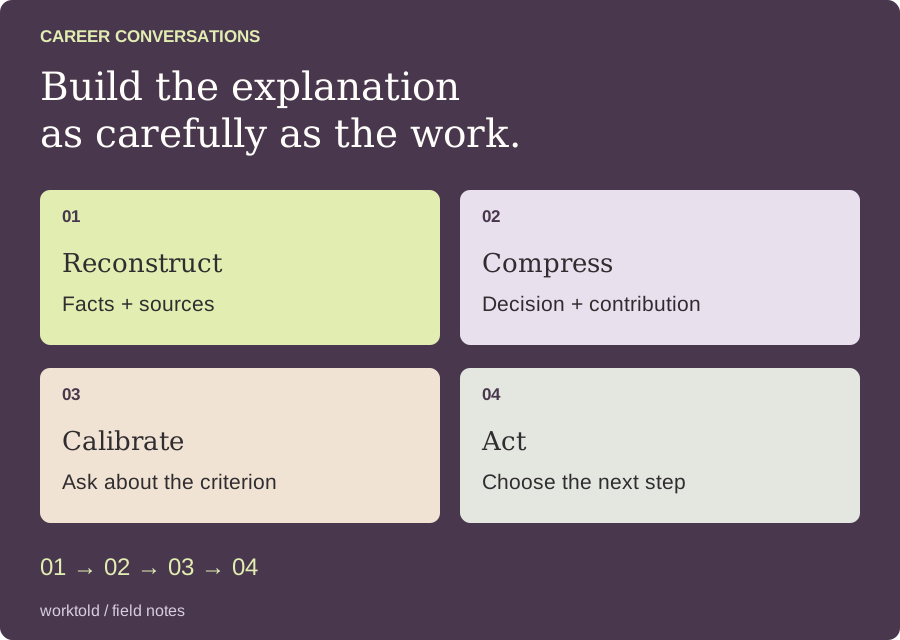
Measure platform-engineering impact by connecting a technical change to an observed effect on the people or systems it serves. Keep measured results separate from estimates. Faster builds, fewer support requests, and easier adoption can all matter, but they do not automatically translate into employee hours saved or cash savings.
Platform work often disappears behind other teams’ launches. The team notices when the build is broken and may stop noticing when it becomes dependable. A good impact record makes the change understandable without pretending that every improvement has a precise dollar value.
Aida’s article on platform promotion packets argues for explaining technical work in business terms. The principle is useful. The new examples below add a stricter distinction between elapsed system time, active waiting, capacity, and actual financial savings.
Start with the chain of effects
Write the technical change first. Then identify who experiences a difference, how frequently, and what observable behavior changed. A shorter build might reduce blocked waiting, enable more frequent testing, or simply finish sooner while the engineer is doing something else. Those are different outcomes.
Do not skip directly from a latency graph to a revenue claim. Name the intermediate links and measure the ones that matter. If you cannot establish a link, preserve it as a hypothesis for a later measurement.
A worked example with honest arithmetic
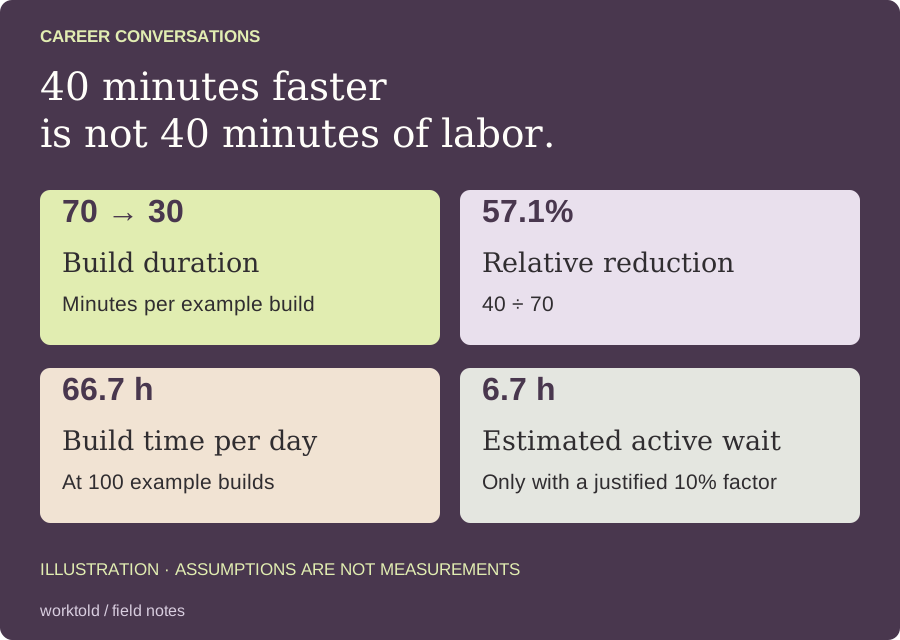
Suppose a representative build falls from 70 minutes to 30 minutes. The decrease is 40 minutes, or about 57.1% of the original duration: (70 − 30) ÷ 70. Thirty minutes is about 42.9% of the original duration; it is not a 43% reduction. This is an illustrative calculation, not an observed customer result.
At 100 such builds a day, the aggregate reduction is 4,000 build-minutes, or about 66.7 build-hours per day. That does not establish 66.7 engineer-hours saved. Builds can run concurrently, and people may work while they run.
Scroll sideways to see all columns.
| Quantity | Calculation | Valid interpretation |
|---|---|---|
| Elapsed reduction per build | 70 − 30 = 40 minutes | This build completes sooner |
| Relative reduction | 40 ÷ 70 ≈ 57.1% | Duration reduction versus the original baseline |
| Aggregate build-time reduction | 40 × 100 ÷ 60 ≈ 66.7 hours/day | Summed elapsed duration across builds |
| Illustrative active wait reduction | 40 × 0.10 × 100 ÷ 60 ≈ 6.7 hours/day | An estimate only if a 10% active-wait assumption is justified |
The 10% factor is invented for the example. Measure or validate it before using it in a real case. Even a defensible active-wait estimate represents available capacity, not automatically a payroll reduction. Cash savings require an actual avoided cost, reduced bill, or another financial change you can substantiate.
Design the measurement before the change
Define the population: which repositories, build types, branches, and machines are included? Compare similar workloads. If the later sample has fewer tests or different hardware, report the change and its effect on interpretation.
Choose a time window long enough to capture normal variation. Report the distribution where it matters. A median improvement can coexist with poor tail behavior, and the slowest builds may be the ones blocking releases. Keep the original query or dashboard reference so another person can inspect the comparison.
Then describe attribution. Did your work cause the change, contribute alongside other changes, or merely coincide with it? If several improvements landed together, say that the result is shared. Precision about causality is a strength in an engineering review.
Measure work that is not about speed
For a shared library, inspect adoption and the problems adopters encounter. “Published the library” is delivery. “Two teams completed migration using the documented path” is an adoption result. “All teams are more productive” is a much larger claim requiring more evidence.
For operational work, look at the relevant incident or support pattern. A runbook may help responders follow a procedure, but the existence of a document alone does not prove shorter incidents. Record usage, feedback, and any measurable change with its limits.
For a risky migration, success may include identifying incompatibilities before rollout. Explain the tests and the decisions they changed. Avoid pricing a hypothetical disaster as money saved unless a rigorous, agreed method supports the estimate.
Write the impact paragraph in layers
I changed [technical mechanism] for [defined population]. In [measurement window], [metric] moved from [baseline] to [result]. [Other contributors or changes] also affected the result. We observed [user or team effect]. [Estimated consequence] remains an estimate based on [assumptions].
This format lets a reviewer distinguish the result from the interpretation. It also tells you what to measure next. You can publish a useful internal update before every downstream effect is known, as long as the uncertainty stays visible.
- Define the metric, population, and time window.
- Check the percentage denominator.
- Separate elapsed time from active human waiting.
- Label assumptions and show the calculation.
- Distinguish capacity from realized financial savings.
- Explain shared attribution and remaining uncertainty.
Use the result in a self-review example or a project-selection discussion. A journal such as the one illustrated in Worktold’s demo can organize the evidence; it cannot make an unsupported estimate true.
Written for Worktold using public sources and original illustrative examples. Product research checked November 10, 2026. Read our editorial approach and comparison limits.